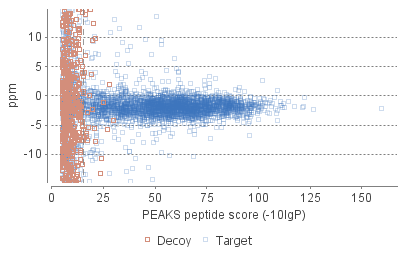
Figure 2(a) and 2(b) show the peptide psm score distribution of PSMs. When FDR estimation is enabled in PEAKS Search parameters, target and decoy matches are respectively shown in two different colors.
Figure 2(a) is a stacked histogram showing the number of target and decoy matches in each score interval. You should observe a similar number of the target and decoy matches with low scores, and observe very few decoy matches with high scores. The vertical line indicates the current score threshold.
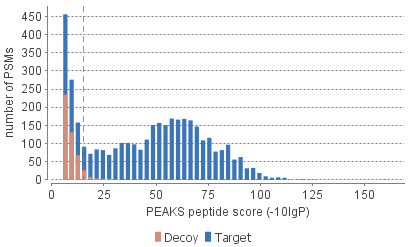
Figure 2(b) is a scatterplot showing the peptide score versus precursor mass error in ppm for all PSMs. This figure is most useful for high resolution instruments. You should observe PSMs with high scores centered near the mass error 0, and observe PSMs with low scores scatter to larger mass error. The vertical line indicates the current score threshold.