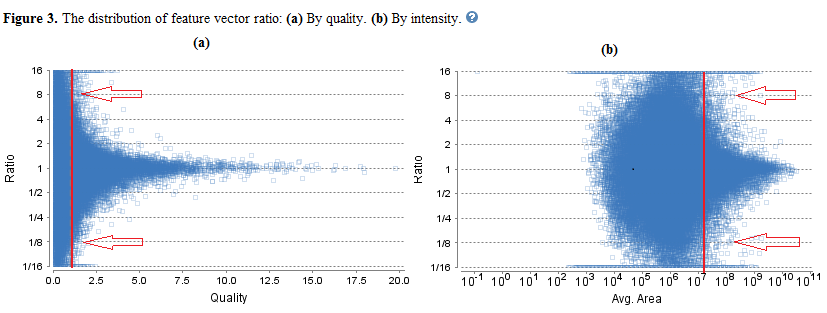
Figures 3(a) and 3(b) plots the distribution of feature vector ratios by quality and by average area respectively. These plots help to determine the threshold values for quality and intensity filters to obtain reliable section of the analysis results. The rule of thumb is to set the quality threshold around 8 fold change as shown below in 3(a). Usually quality filter is a better filter to use. But under some circumstance, you may want to apply the filter to the MS signal directly. The rule of thumb is still to choose the average area around 8 fold change. In both figures, the ratio is the group ratio to the base group. If more than two groups present then each ratio value depicts a data point in the figures.