Updated 2020-03-20
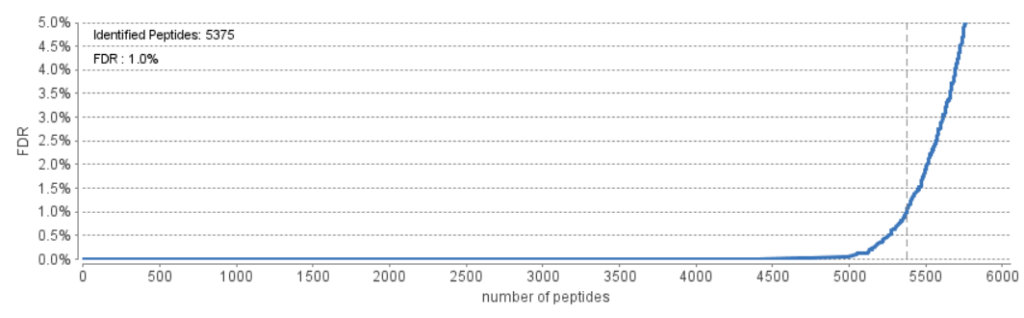
As of the latest release of PEAKS X+ (build 20200219), users will find that the FDR curve displays the number of identified peptides at a given percent FDR. This is different to older versions of PEAKS which displayed the number of peptide-spectrum matches (PSMs) at a given percent FDR.
Recall, a PSM in mass spectrometry, or peptide sequence match, is a spectrum which is associated with a peptide sequence. It is the identification of PSMs which is essential for the makeup of proteomes with LC-MS/MS. The output of all analysis then is basically peptide spectrum matches with a score. Identified peptide sequences may be supported by multiple PSMs, but PEAKS will only count these as one including those peptides with only I/L isoform difference. Thus, the number of peptides is the same as the number of peptide sequences matched to the target and contaminant database. The peptides are sorted according to their -10lgP scores.
When looking at the figure, the curve graphs the number of peptides that pass a given FDR threshold. The vertical dashed line indicates the current FDR filter set to easily determine how many peptides will be reported in the results. Normally a <1% FDR is recommended for score filtering. But if you notice a rapid growth of FDR around the 1% FDR threshold, you may decide to sacrifice several peptides to significantly reduce the FDR.
However, users will still be able to determine the FDR of the results at the PSM level. To do so, continue scrolling down the Summary result tab to find “Table 3. Statistics of Filtered Results”. Here, the FDR is indicated at the PSM, peptide and protein group levels.
FDR is estimated with the decoy fusion method (an enhanced target-decoy method, see “False Discovery Rate Validation”). To enable this function, the “Estimate FDR” checkbox must be checked when setting up the database search parameters in PEAKS.